
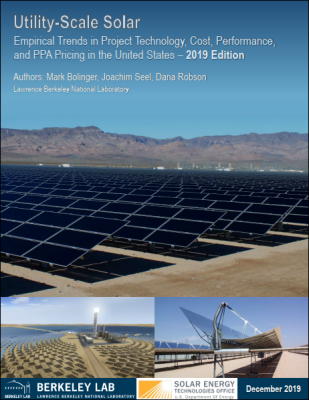
The utility-scale solar sector has led the overall U.S. solar market in terms of installed capacity since 2012. In 2018, the utility-scale sector accounted for nearly 60% of all new solar capacity, and is expected to maintain its market-leading position for at least another six years. More than three-quarters of all states, representing all regions of the country, are now home to one or more utility-scale solar projects.
This report—the seventh in an ongoing annual series—provides in-depth data-driven analysis of the utility-scale solar project fleet in the United States. Drawing on empirical project-level data from a wide range of sources, this report analyzes technology trends, installed project prices, operating costs, capacity factors, power purchase agreement (“PPA”) prices, the levelized cost of solar energy (LCOE), and the market value of solar. The report also includes data and observations about completed or recently announced solar+storage projects.
Para mayor información visitar el siguiente enlace:
https://emp.lbl.gov/utility-scale-solar/
https://emp.lbl.gov/sites/default/files/lbnl_utility_scale_solar_2019_edition_final.pdf
Compartir artículo
Para información general sobre la organización: difusion@colombiainteligente.org | Dirección: Edf. TecnoParque Cr 46#56-11 Piso 13 | Medellín – Colombia
Teléfono: +57-4-4441211 Ext. 171 | FAX: +57-4-4440460

Los documentos se clasifican en varios colores tipo semáforo tecnológico que indican el nivel de implementación de la tecnología en el país
Tecnología en investigación que no ha sido estudiado o reglamentado por entidades del sector.
La tecnología se aplica de manera focal y se encuentra en estudio por parte de las entidades del sector.
La tecnología se aplica de manera escalable y se encuentran políticas y regulaciones focales establecidas.
La tecnología se aplica a través de servicios y se encuentran políticas y regulaciones transversales establecidas.
La tecnología se aplica de manera generalizada y se tiene un despliegue masivo de esta.
Para acceder a todos los documentos publicados y descargarlos ingresa aquí